Current Market Perspective: Moderately bearish based on three pieces of information:
- Our bottom-up security selection process is revealing few bargains;
- Total public and private debt in developed countries is unsustainably high relative to GDP and will require long, painful de-leveraging a la Rogoff and Reinhart; and
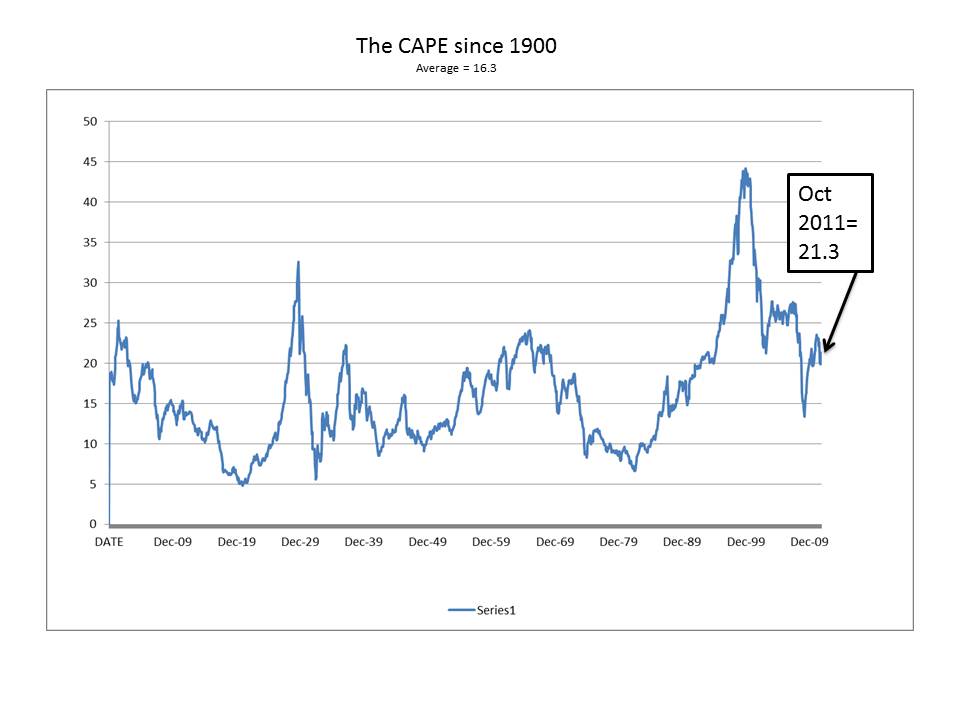
- The Cyclically Adjusted Price Earnings (CAPE) ratio and Tobin’s Q ratio for the overall US market are near all-time highs (excluding the dot com bubble);
The CAPE was first written about by Benjamin Graham and its inputs are updated regularly by Professor Robert Shiller of Yale University. The data can be found here:(http://www.econ.yale.edu/~shiller/data.htm).
The CAPE–which equals the current market price of the S&P 500 index divided by a moving ten-year average of earnings for the 500 companies–has been a reliable indicator of long-run equity market returns. When the CAPE has been high, real returns over the subsequent ten years have been low, and when it has been low, real returns have been high. For my first Counterfactual Friday post, I will challenge my perception on the current level of the CAPE, which has influenced me to purchase puts on the US equity market that have a notional amount equal to about half of the capital that I manage. Our first purchase was made in March and the puts are long dated.
The CAPE is currently thirty-one percent above its 16.3 average since 1900. 
The argument against relying on the CAPE now, whose proponents include Professor Jeremy Segal of the University of Pennsylvania, has been that the last ten years have been so unusual that they make the CAPE less reliable. According to these detractors, real earnings–the denominator of the CAPE–have been unusally hurt by two severe recessions in the last ten years.
The last ten years of earnings include the effects of the 2001 recession, most of which will roll off in the next two years. Therefore, I decided to see what would happen if we let those two years roll off while we kept the real earnings per share at current levels for the next two years (earnings data takes longer to obtain, so Professor Shiller’s current earnings are the earnings as of June 2011). Obviously there are a lot of simplifying assumptions in such a result including that market prices remain perfectly flat, that no recession causes earnings to decline, and that there is absolutely no inflation, all of which should make the ratio appear less inflated.
The result is that the CAPE declines from 21.3 to 17.2 by October 2013. That certainly is a more realistic multiple relative to history.
Still, it is not exactly encouraging. Despite removing the effects of the 2001 recession; despite holding market prices in the data flat; and despite unrealistically assuming that there will be no inflation to reduce real earnings over the next two years, we still could not force the CAPE to drop below its long-run average. It will still be more than five percent above it.
What will happen if we get another recession in the near term or some inflation? And, some recent analysis of the effects of power law distributions at work in the financial markets suggest that we get one significantly larger-than-expected event every 1,000 or so trading days. October 2013 to December 2013 is in a 1,000-trading day range since the last event in the fourth quarter 2008. That does not mean that a large, bad event will happen by then, just that it is more likely than we think based on Gaussian distributions. Then again, large positive moves like the unexpected 13% gains this month count as a power law move also.
Although significant earnings growth could offset any inflation and get us back to the CAPE’s long-run average in three years, given Rogoff and Reinhart’s analysis I do not think that is likely, and I think the market is in more precarious shape than I thought before I conducted this exercise. It was supposed to challenge my view. So much for Counterfactual Friday.
Please help me poke holes in my reasoning.
