I have excerpted part of PAR’s semi-annual letter that PAR sent to clients on July 7, 2014, and I have pasted it below. No one knows where the market is going to end up in the near term, but over the long haul (ten- to twenty-years), the odds are that returns will be lower than they have been in the lifetime of anyone born after 1945. Risk management and discipline will separate successful investors from unsuccessful ones.
Hire advisors who understand risk and know how to manage it well.
The Market from the Top Down, the Federal Reserve, and the Economy
PAR’s pessimism is due to a dearth of bottom-up bargains. (Few businesses can be purchased at prices that deliver a margin of safety.)
A top-down analysis reveals a significantly overvalued market, which merely confirms the dearth of bargains. Shiller’s CAPE, Buffett’s PE, Tobin’s Q, and profit margins are at or near all-time highs (other than during the dotcom bubble) while interest rates are near historic lows.
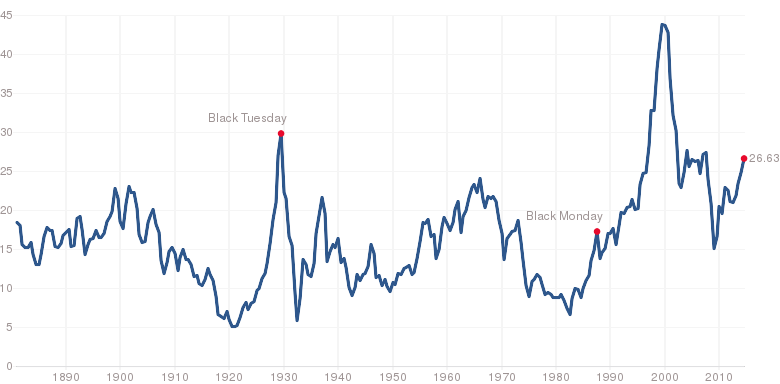
Shiller’s CAPE
As of July 3, the CAPE was 26.6, which would require a 31% drop to reach its post-war average of 18.4 (including the dotcom bubble in that average).
Shiller’s CAPE (S&P 500 Index /10-Year Average Earnings)
Source: Multipl.com and www.econ.yale.edu/~Shiller/data.htm
I have been writing about the CAPE for a while in letters and on my blog. Although it has been above its long-term average since early 2009 (and for most of the time since 1990), it is not a good indicator for short-term market timing.
At these CAPE levels, stocks are unlikely to deliver much more than low single-digit returns per year over the next decade and the market is vulnerable to large corrections. Since 1881, with the exception of the dotcom bubble, every time that the CAPE reached 24 (April 1901, November 1928, and January 1966) inflation-adjusted losses of 29% or more followed within 4.5 years and peak-to-trough losses were much higher. In this cycle, the CAPE first reached 24 in November 2013. But the market has also severely corrected when the CAPE was lower than 24.
William Poundstone wrote the following in his latest book, Rock Breaks Scissors:
“Today’s investors have every right to feel cursed. They have had few opportunities to buy at average (CAPE levels) much less low ones…The average return at (a CAPE of 23) is something like 2 percent over the coming 20 years. Never has the twenty-year stock market returned as much as 3 percent annually (after inflation) when the (CAPE) was 23 or higher.”
Largely because of the CAPE level, as of May 31, 2014, GMO thinks that US large-cap and small-cap stock real returns will average -1.5% and -4.5%, respectively, each year for the next seven years.
Market Cap-to-GDP (AKA Buffett’s PE)
Buffett’s favorite measure of market price-to-earnings is the ratio depicted in the chart below, which indicates that the market is about 45% overvalued.
Source Listed in Chart
GMO believes that whenever a measure of market prices (relative to market fundamentals) is two standard deviations from its long-term average, then that market is in a bubble. According to GMO’s definition, Buffett’s PE indicates the market is currently in a bubble. However, Grantham prefers the CAPE (along with other measures) over Buffett’s PE and he believes the S&P 500 will not enter bubble territory until it reaches about 2,250. As of July 4, it’s only 13% away from that mark.
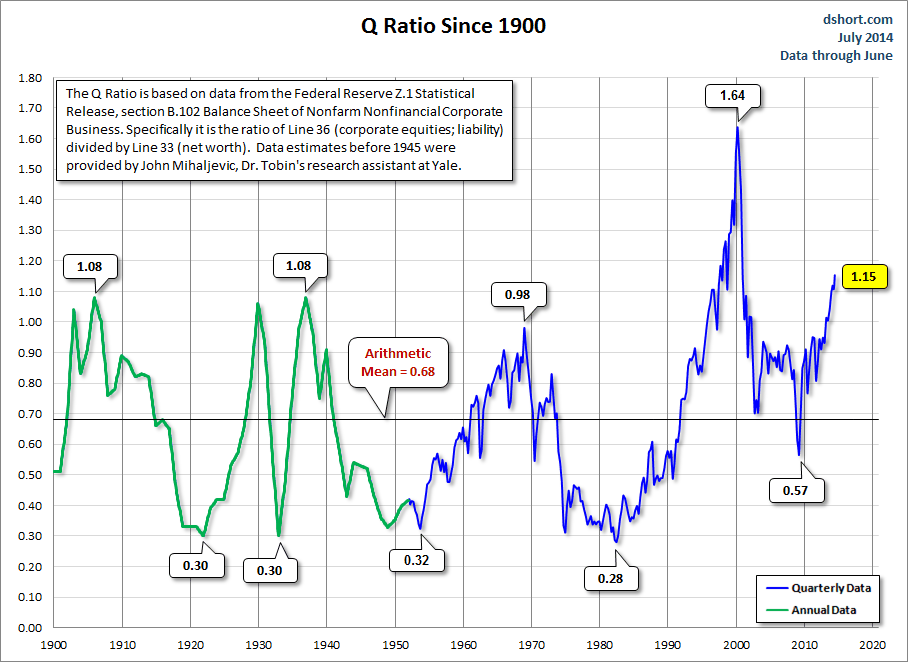
Tobin’s Q
Tobin’s Q Ratio is a measure of the market’s price-to-book ratio. It equals market value relative to the cost to replace the assets of the businesses in the market. The numerator is the same as the one in Buffett’s PE Ratio. The Q indicates that the market is about 41% overvalued.
Source Listed in Chart
Profit Margins
Corporate profit margins are at all-time highs. Because high profit margins attract competition in free markets, Jeremy Grantham of GMO calls margins the most mean-reverting statistic in finance and economics. If margins decline, EPS will decline, leading to a decline in stock prices.
Corporate Profit Margins
Source Listed in Chart and dshort.com
John Hussman of Hussman Funds notes that investors who pay high prices for high profit margins are almost always disappointed in profit growth later.
Source: Hussman Funds
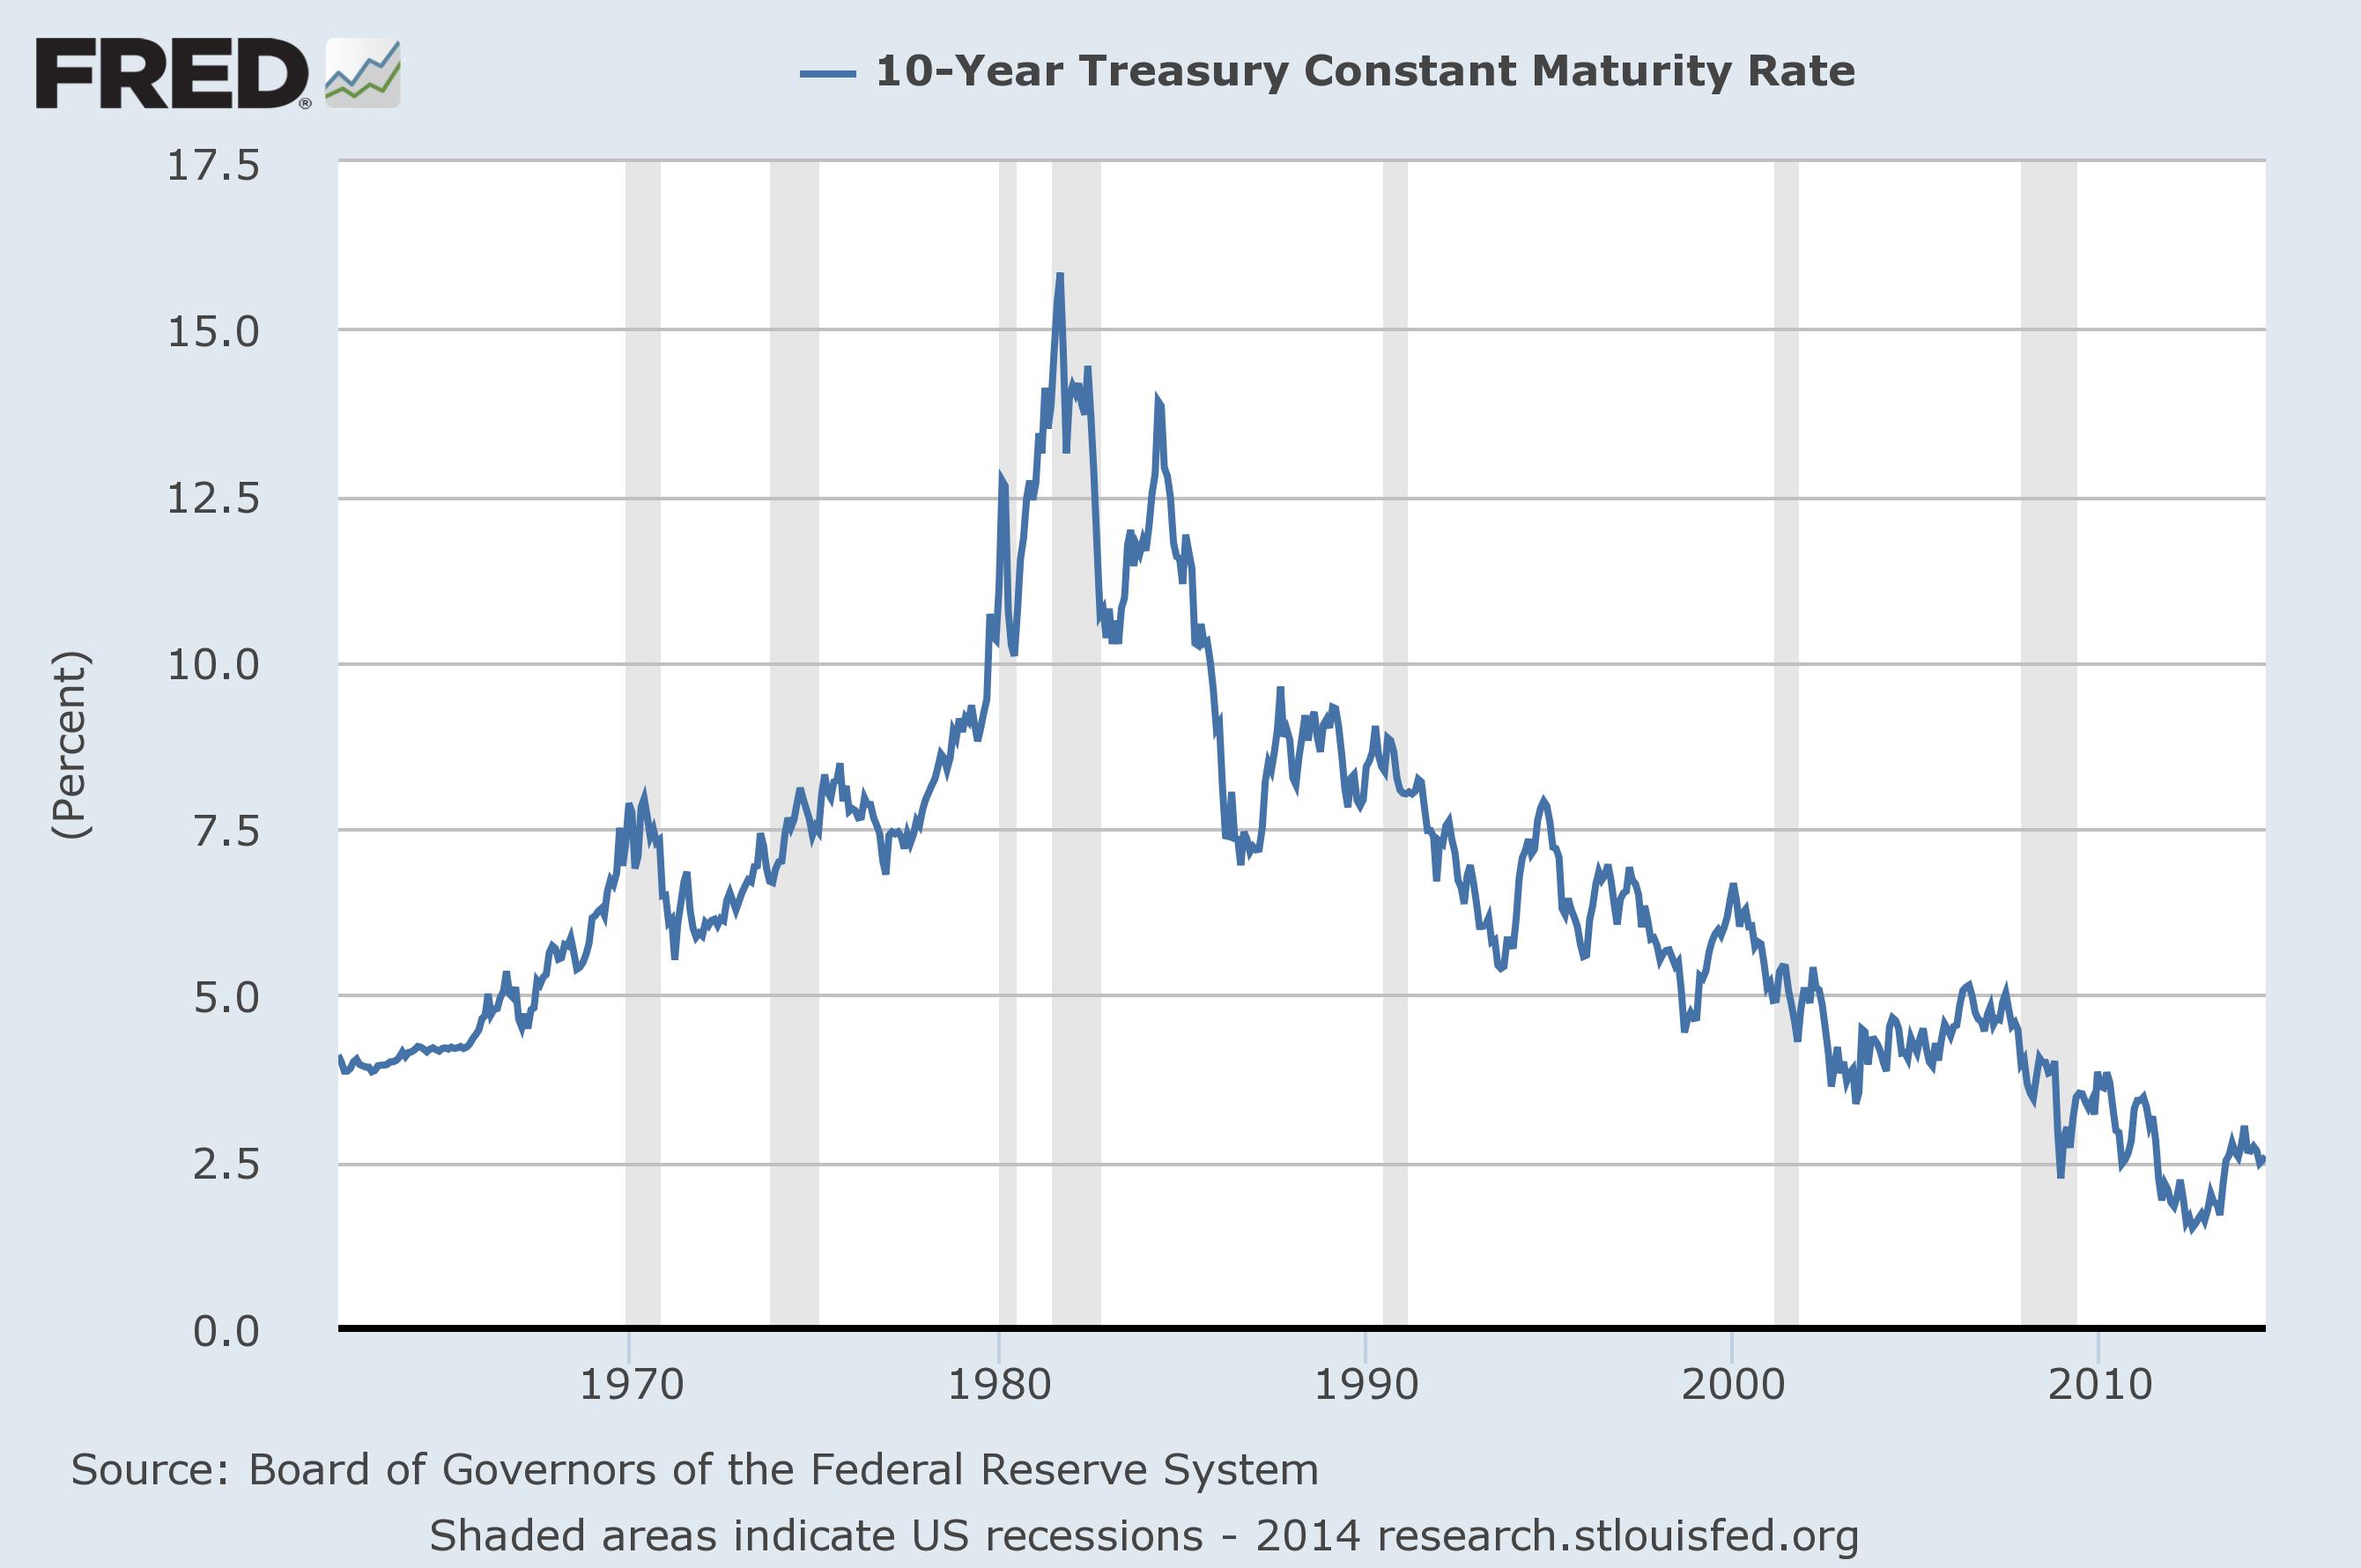
Interest Rates
Interest rates are important because declining rates translate into a higher present value of cash flow, which translates into higher asset prices. It is hard to imagine rates falling much more from here after the 33-year bull market in bonds, but it is easy to imagine rates rising, which will cause present values (and markets) to decline, all other things being equal.
Source Listed in Chart
The Federal Reserve
“This goes down right now as the mother of all reflation strategies by the Federal Reserve…The cycle starts off with asset inflation, followed by credit inflation, followed by price inflation, and then by wage inflation.” –David Rosenberg, on CNBC’s Squawk on the Street 6/24/14
It appears that a major reason for the market’s rise since 2010 has been the extraordinary measures used by the Federal Reserve to offset the effects of the financial crisis. Quantitative Easing 1, 2, and 3 (QE) has created an environment for company stock buybacks and M&A activity largely by lowering the cost of corporate debt issuance to finance buybacks and M&A.
In 2013, S&P 500 company buybacks totaled $477 Billion, the most since the 2007 peak. Fortuna Advisors estimates that since the 2009 lows, buybacks juiced cumulative returns from a natural 80% to a steroid-like 178% reached in the first quarter of 2014.
Of course, it is what happens at the margin—the last trade—that determines your portfolio value. The stock of corporate buybacks over the last three years will be of little consolation in a declining market unless you have already sold into buybacks and are holding the proceeds in cash.
Further evidence of a Fed-fueled market include: 1) margin debt used to purchase equities is as high as in the dotcom bubble; 2) the junk bond market has been raging again; and 3) IPOs—insiders who want to cash out before the punch bowl is pulled away—are as high as in the dotcom era.
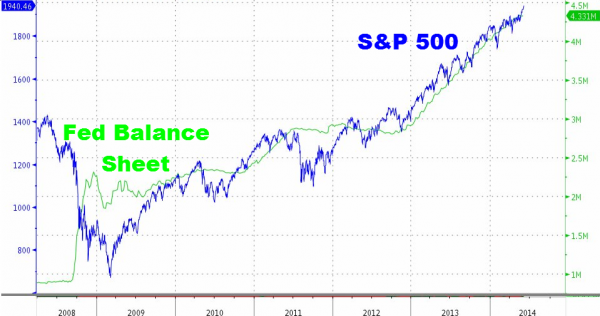
Correlation is not causation, but there is good reason to believe the Federal Reserve’s extraordinary balance sheet expansion since the crisis (depicted below) is responsible for much of the froth.
Source: ZeroHedge.com
A 2000 publication from the CFA Institute’s Research Foundation studied asset class returns during periods of expansionary and restrictive monetary policy. It should give pause.
The study (http://www.cfapubs.org/doi/abs/10.2470/rf.v2000.n3.3912) covered the years 1960 through 1998. The average monthly nominal stock market return in expansionary periods was 1.64%. The average in restrictive periods was 0.38%. All eleven periods of expansionary monetary policy over those 38 years resulted in a positive monthly average real return, but five out of the ten (50%) restrictive periods resulted in negative average monthly real returns. Clearly, the maxim “Don’t fight the fed” has a lot of truth in it.
David Tepper
One investor who refused to fight the Fed was the highest earning hedge fund manager in 2013. On September 24, 2010, David Tepper presciently said the following on CNBC:
“Either the economy is going to get better by itself in the next three months…What assets are going to do well? Stocks are going to do well, bonds won’t do so well, gold won’t do as well…Or the economy is not going to pick up in the next three months and the Fed is going to come in with QE (and the stock market will rise because of that).”
Tepper repeated that analysis several times into 2013. Today, we know he was right because the Fed came to the rescue with QE several times.
So, it should be a concern that the Fed has already begun to pull back. QE is tapering and will likely end by October 2014, and three of the seventeen Federal Reserve officials responsible for setting the fed funds rate believe it will rise in 2014. Twelve think it will rise in 2015. Only two of the seventeen believe fed funds will not rise until 2016. Nine of the seventeen believe the fed funds target rate will rise from its current 0%-0.25% to at least 1% next year. Three believe it will rise to 3% or higher, which would be a striking change.
(http://www.federalreserve.gov/monetarypolicy/files/fomcprojtabl20130918.pdf).
But, make no mistake, whenever the fed funds rate rises, many investors will be surprised. According to the Research Foundation’s Fed study, the average equity return following a Fed interest rate policy increase was most pronounced in the month of the policy change, indicating that it wasn’t expected. The second-most pronounced effect of an increase came in the next month following the policy change. For the first month in a tightening period, stocks declined an average 2.05%.
So, what does Tepper think now? At the SALT Conference on May 14, 2014 he said:
“…there (are) times to make money and there (are) times not to lose money. This is probably (a time when) you’re supposed to think about preserving some of your money. If you’re 120 percent invested, it’s probably too much. You can still be long, but you probably should have some cash…I am nervous. I think it’s nervous time.”
Tepper’s fund cut its net long exposure from 100% in December 2013 to 60% in May 2014.
(http://www.cnbc.com/id/101674055)
Employment
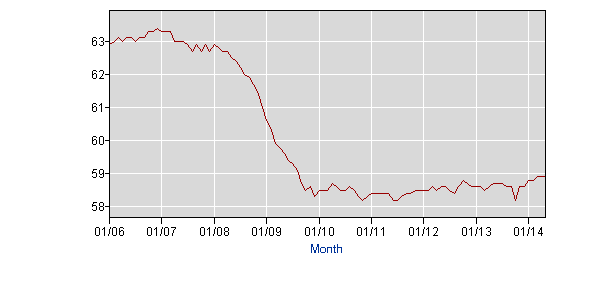
While the market rose 144% since January 1, 2009, the underlying fundamentals of the economy have been weak, which is further evidence that the market has been largely driven by the Fed. GDP declined in the first quarter by a whopping 2.9%. Bad weather cannot explain the long-term weakness in the ratio of Employment-to-Population (E/Pop), which has barely budged from the nadir (58.2%) since the crisis abated. The chart of this ratio does not look like an economy that can justify a 144% rise in the S&P 500 Total Return Index since January 1, 2009 or 178% since the nadir.
Ratio of Employment-to-Population (January 2006 through May 2014)
Source: BLS
Unlike the unemployment rate and the Labor Force Participation Rate, the E/Pop ratio implicitly assumes that every unemployed person of working age is looking for work. It may be the best indicator of economic robustness. The E/Pop has not been this low since the effects of the “malaise” of the 1970s, yet the S&P 500 Index has hit all-time highs dozens of times already this year. (http://www.bls.gov/opub/mlr/1981/02/art4full.pdf)
We probably should not anchor on the post-war high E/Pop of 64.7% in April 2000, or even the post-dotcom bust of 63.3% last reached in March 2007, but the 58.2% read in October 2013 is a post-1983 low. The latest figure is from June 2014. It is just 59%.
The Other Side of the Inflated-Market Argument
To help combat confirmation bias, I now present the other side to the top-down view that markets are inflated and approaching a bubble. Most of the counter-argument centers on four ideas: 1) there are flaws in each of the metrics outlined above; 2) after six years of anemic economic growth, the economy is due to break out; 3) forward PE ratios (today’s price relative to analysts’ earnings per share estimates for 2015) are not extraordinarily high; and 4) it’s different this time, so the Federal Reserve will not be able to tighten because the economy will not be strong enough. (Note to blog readers: the argument that stocks are the best alternative is not addressed here because the letter makes clear that PAR believes all markets–stocks, bonds, housing, etc.–are inflated beyond levels that are justified by fundamentals.)
Point four contradicts the other points. For example, if it is different this time and the economy is not strong enough for the Fed to tighten, then it is hard to argue that forward earnings will be good or that the other metrics would point to better conditions if they weren’t so flawed. At least in the pessimistic case, all compasses point in the same direction.
I think I understand all of the identified flaws in each metric above (e.g. flaw: “the CAPE in 2012 was distorted by two recessions, which is unlikely to be repeated”) even if I disagree with the rationales for why they are flaws (e.g. Shiller used a ten-year horizon to capture long cycles). Also, the various flaws have always been in the measures, which make trends important. It is the trends that are troubling.
I do not know where the economy is headed and I don’t know where earnings will be next year. But, I do agree with Steven Levitt and Stephen Dubner, who wrote the following in their latest book, Think Like a Freak:
“It has long been said that the three hardest words to say in the English language are ‘I Love You.’ We heartily disagree! For most people, it is much harder to say ‘I don’t know.’”
David Dreman demonstrated that analyst EPS estimates have been far off the mark for a long time. But, analysts have to keep on guessing because their institutional clients demand it and they cannot tell their clients the truth: that they just don’t know what forward EPS will be and that they could deliver more value to clients if clients would let them focus instead on what can be known about a business. Given analysts’ abysmal records in forecasting EPS, how can anyone find comfort in forward PE estimates?
I hope the economy surprises to the upside and justifies today’s high stock market prices. All PAR can do is stick with its Separate Account Value Investing (SAVI)* discipline and buy stocks only when PAR finds a margin of safety, and “buy” call options that never expire on every company in the market (i.e. hold cash) when margins of safety do not exist. Those call options will be valuable one day.
Discipline is the key.
* SAVI is a separate account platform with Charles Schwab in which PAR invests client funds using PAR’s value investing processes. Clients have complete transparency into PAR’s activity in their account and clients control their separate account. Client funds are not commingled in the SAVI platform, so clients receive asset management tailored to their needs.

